How safe are our roads?

When heading out on the road, very few people would stop consider whether they are doing something dangerous. Videos and news stories across social media can be used to paint a misleading picture. Here our road accident claims team looks at some recent road safety statistics.
How many crashes are there on average each year in Great Britain?
We don’t know how many crashes there are because lots of crashes are unreported. The data that is available helps us to get a reasonably good understanding of the number of injuries and fatalities on our roads.
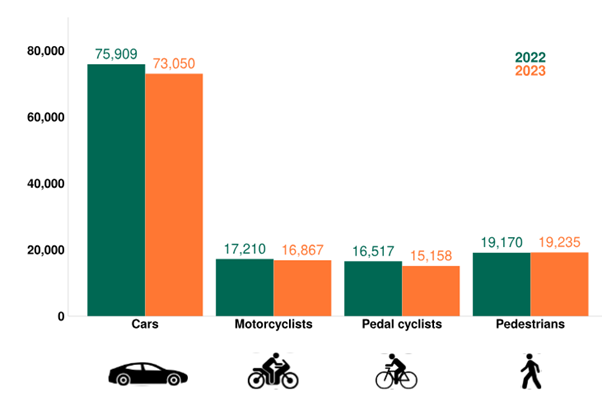
According to provisional Government statistics, in reported road collisions in Great Britain in 2023 there were an estimated 132,063 casualties of all severities, a reduction of 3% compared to 2022. The total number of casualties in the graphs below, shows there wasn’t much change from 2022 compared to 2023.

How many people are killed on the roads each year in Great Britain?
In 2023, 1,645 people were killed on the road according to provisional Government data. This is compared to 1,711 in 2022.
Whilst the number of fatalities have increased in recent years due to the country re-opening after COVID-19, the general trend in numbers and rates of fatalities appears to be steadily reducing.
In 2023, 46% of fatalities were car occupants, 25% were pedestrians, 19% were motorcyclists and 5% were pedal cyclists.
Causes of accidents in the UK.
What is the biggest cause of accidents?
According to the latest Government data, the biggest cause of fatal accidents in Great Britain is a loss of control of a vehicle, at 24% of accidents.
As with calculating the number of crashes across the country, due to various aspects of reporting feeding into available Government information the full picture is difficult to ascertain.
However, data is available on what is known as ‘contributory factors’ to fatalities on Great Britain’s roads. This gives us some indication as to what is causing some of the worst accidents on our roads.
It should be noted that ‘contributory factors’ are decided upon by the police officer at the scene, and is left up to their professional judgement as opposed to being as the result of an official investigation.
With this in mind the top 10 contributory factors for fatal accidents in 2022 were as follows (with codes removed):
| Contributory factor | Percentage with factor |
| Loss of control | 24 |
| Driver/Rider failed to look properly | 23 |
| Driver/Rider careless, reckless or in a hurry | 21 |
| Exceeding speed limit | 19 |
| Driver/Rider failed to judge other person`s path or speed | 11 |
| Poor turn or manoeuvre | 11 |
| Driver/Rider impaired by alcohol | 10 |
| Travelling too fast for conditions | 8 |
| Driver/Rider illness or disability, mental or physical | 8 |
| Aggressive driving | 8 |
Where do most accidents happen?
According to the RAC, who base their information on data from 2022, most accidents occur on built-up urban roads. However, they also note that the majority of fatalities occur on rural roads.
If you’re interested in understanding the risks in your local area, a helpful website is Crash Map. It shows where accidents have occurred by differing levels of severity.
How safe are motorways?
Despite the high speeds on motorways, the likelihood of an accident resulting injury on a motorway is lower when compared to urban and rural roads. Despite carrying 21% of traffic in 2022 motorway accidents accounted for just 6% of fatalities and 4% of casualties on our roads, when compared to rural roads carrying 44% of traffic and accounting for 59% of fatalities for example. This is outlined in the RAC data mentioned above, for reference.
Are smart motorways safer?
It is difficult to say, as there are conflicting accounts on the safety of smart motorways.
On the one hand, BBC Panorama investigations suggest that a lack of hard shoulder in some places could be a serious risk to drivers (which appears to be backed up by National Highways figures), saying data suggests you are three times more likely to be killed or seriously injured on a motorway with no hard shoulder when compared to a road with one.
And yet, National Highways themselves say that smart motorway schemes have “seen a reduction in PIC [personal injury collision] rates after they were constructed”, with most schemes also seeing “a reduction in FWI [fatal and weighted injuries] rates, which place a greater emphasis on deaths and serious injuries, when comparing the before and after periods”.
It is worth mentioning though that National Highways also says that radar detects 89% of stopped vehicles, meaning one in ten is not spotted.
Who is most at risk of accidents on our roads?
Who’s most likely to be injured?
Government data can give some insight as to who is being injured most frequently on our roads. According to the latest data, the largest proportion of road casualties of any severity were males (61%). Over half of these were aged 17 to 49 years of age, with the 30 to 49 age group being the majority. In terms of fatalities, 75% are recorded as male fatalities.
What’s the safest mode of transport on our roads?
If we were to simply look at the number of reported casualties and fatalities in the Government data for 2023, at first blush we might think that cycling is the safest mode of transport on our roads. Cyclists make up just 11% of casualties and 5% of fatalities on the road, when compared to 55% and 46% for car occupants.
However, when we look at these figures in the context of road usage statistics we see the stats for casualties per million miles for both accidents involving cars and accidents involving bikes.
| Mode | Million Road miles 2023 | Fatalities 2023 | Casualties 2023 | Deaths per million miles | Casualties per million miles |
| Cars | 251300 | 749 | 72155 | 0.0030 | 0.29 |
| Cycles | 2600 | 84 | 14770 | 0.032 | 5.68 |
If you or someone close to you have been injured in an accident on our roads, contact our specialist injury solicitors to find out if you have a claim for compensation.
Call now


